


One of the biggest pitfalls most people fall into is basing all marketing on emotion and not data.
Today you’ll learn exactly how to set up analytics for a wide range of cases and how to identify with much more precision what your customers are worth and which channels they come from.
With that knowledge, you’ll gain one final insight: what you’re willing to pay for a customer going forward and which channels you should prioritize.
Are you as excited as I am to get started?
Google Analytics
Google Analytics is a free tool from Google that helps website owners track user data. You install a small snippet of code on your site, and then Google starts collecting information about your users.
You can access the data through a user-friendly dashboard in Google Analytics.
There are plenty of guides online on how to install Google Analytics. If you use WordPress, like I do on this website, there are many plugins available that make the process easier—no need to mess with the code yourself.
Don’t have a website yet? Or maybe you don’t have enough traffic to perform real analysis?
Google has recently released a demo account of its Analytics dashboard, where real data is available so you can learn how to navigate.
Go to the Google Analytics demo account
Let’s get started!
In this example, I’m using Google’s demo account.
Where are your customers coming from?
Once you have installed Google Analytics, you should see the following on your screen
The same applies to the demo account
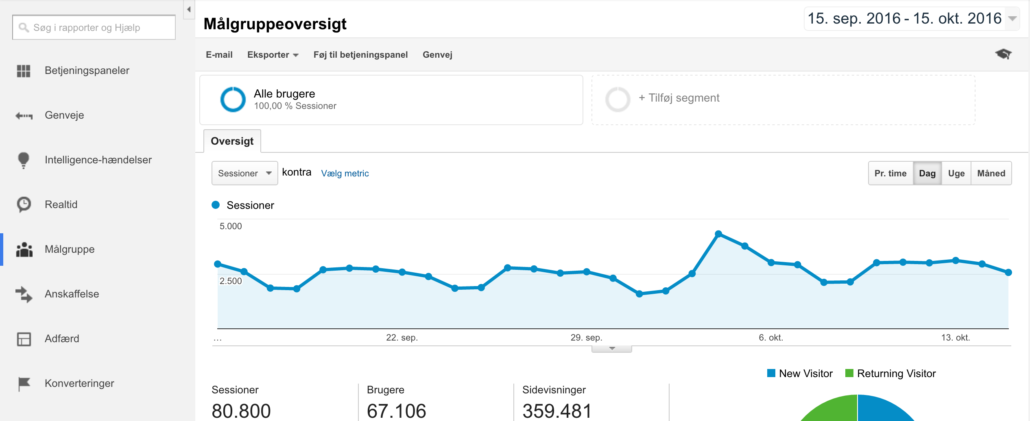
As you can see, we have one month of traffic to our demo site. This means we can view actual data. On the left-hand side, you’ll see how Google categorizes this data.
The most important thing to learn is where your visitors come from.
Try clicking “Acquisition > All traffic > Source / Medium”
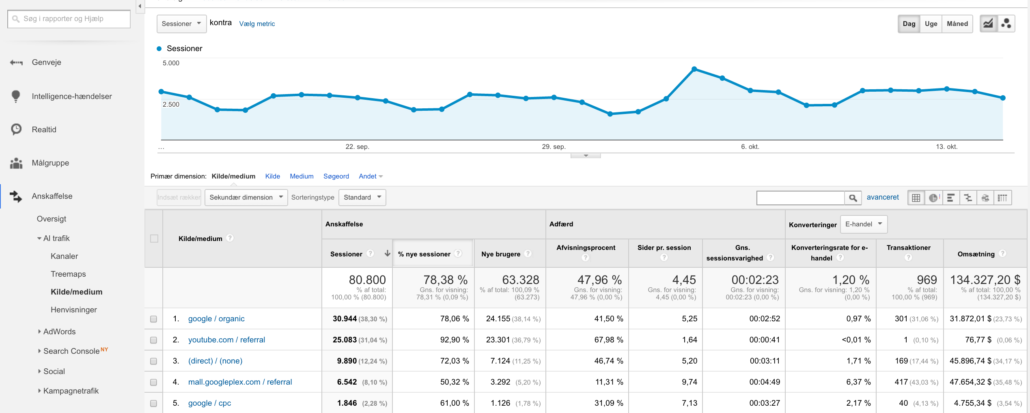
You’ll now see additional data in the table.
Look to the far right—you’ll see number of transactions, conversion rate, and revenue. On the far left, you’ll see “Source / Medium” such as “Google / organic”.
Let’s look closer at these terms:
What does this tell us?
This shows that Google Organic is currently our best-performing traffic source in terms of volume – and it brings in 301 transactions. That’s just one of our sources.
More interesting, however, is the conversion rate—the percentage of traffic that actually turns into customers. As shown in thet hird-to-last columnn, our Google Organic conversion rate is 0.97%.
Conversion rates are influenced by several factors:
- Page speed
- Pricing
- Mobile optimization
- Relevance to the user
That’s why we use A/B split testing—comparing 2–3 variations and choosing the one that performs best.
As shown, YouTube converts poorly—as do most social media platforms – because users typically browse these platforms to consume content or get inspired.
So, sales rarely happen directly on YouTube. Instead, users often go to Google and search for a product they saw in a video.
Where do users land?
When discussing acquisition of potential customers, it’s also important to examine where users land—especially from Google. This can be done in several ways.
Here’s a quick guide:
1. Go back to the previous view/account and click “Google / Organic”
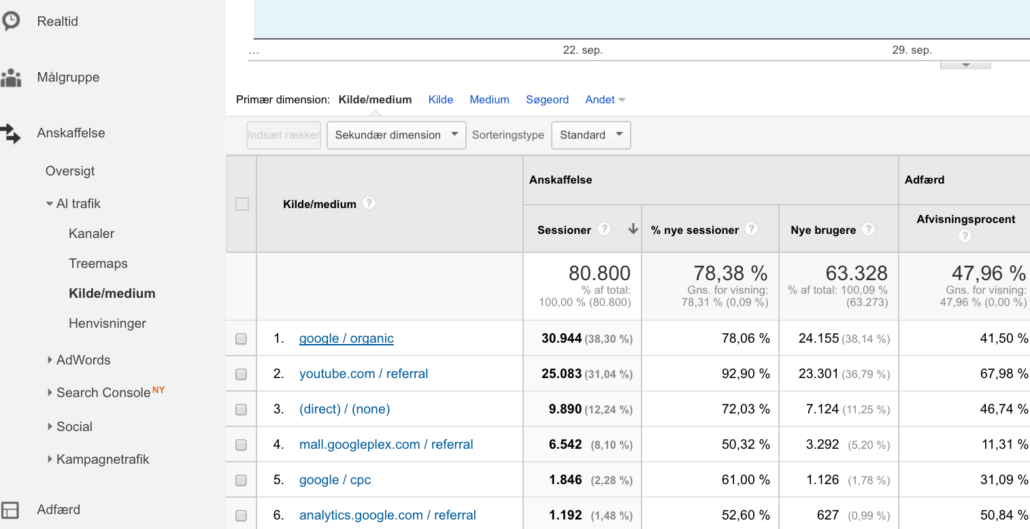
2. This filters for only organic traffic
Then, in the box labeled “Secondary dimension,” select “landing page,” and you will see all the landing pages that people land on via your organic search results from Google.
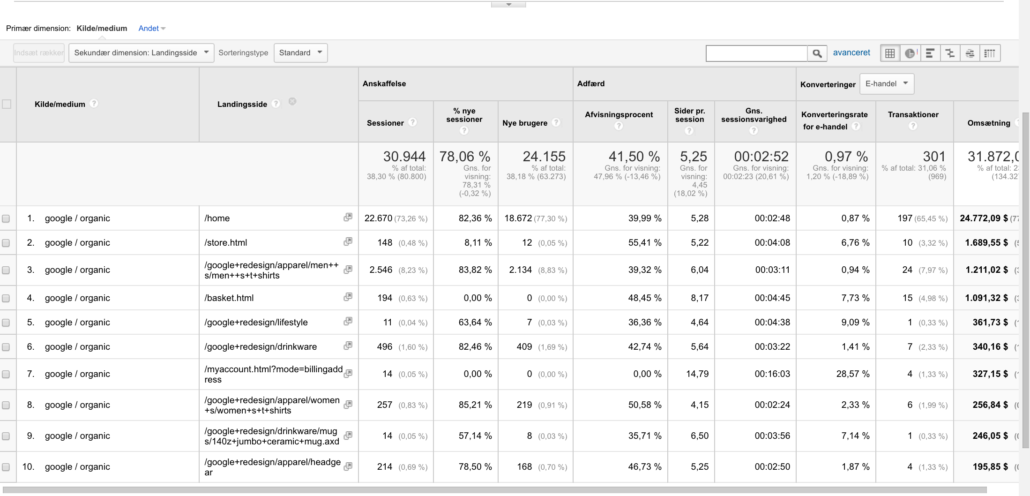
In the second column, you’ll now see all the landing pages as well as:
- Which pages have the best conversion rate
- Which pages drive the most revenue
- Where your traffic ends up
With this knowledge, you can optimize many aspects of your site. You probably know better than I do whether a specific page needs improvements.
#Tip: You can explore your traffic sources freely. If you use external media like Google Ads, Facebook Ads, or collaborate with bloggers, you’ll also find this data under sources. You may uncover hidden opportunities here.
Now that we know how people arrive at your site, how do we understand your audience?
Who is the customer?
When we talk about the “customer,” we also include potential ones. Google Analytics provides valuable insight into your audience.
Let’s go back to the first screenshot. This time, instead of “Acquisition,” choose “Audience”

Click “Audience > Demographics > Overview”
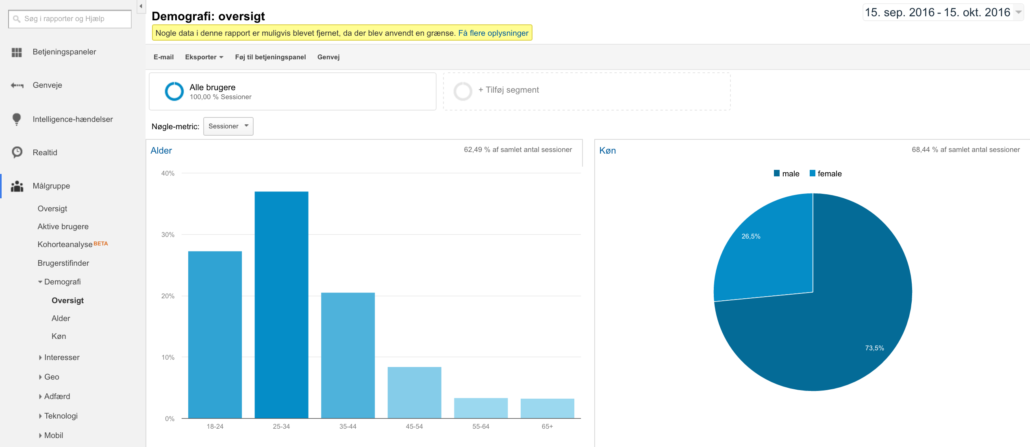
Now you have access to valuable data again. You can now see a wide range of demographics:
- Age
- Gender
- City (if you choose “Geo” in the menu)
Exercises in Google Analytics
Here are some exercises you can use to improve your business through data:
- What products do customers like?
- Which city converts best? Do you only deliver to certain cities?
- Does your product appeal to both genders? Could you expand?
- Check “Technology” on the left—is your site mobile-optimized?
Set small weekly tasks for yourself or feel free to leave a comment below. I’ll gladly give you more exercises to help you improve.
But wait…
What if I don’t run an e-commerce store?
Many people think Google Analytics is only for e-commerce. That’s wrong. I think all websites, especially startups, should use Google Analytics. It’s free and easy to implement.
Real estate agents & Google Analytics
If you’re a real estate agent, you’re probably running ads. I constantly see them in my feeds while daydreaming about a beautiful penthouse. But imagine how many goals they could be setting up?
A goal could be a specific page, like a thank you page users see after submitting a form.
Using goal setup in Google Analytics, you define what counts as a goal. Once defined, you have a real conversion that you can analyze:
- Where did it come from?
- Who completed it?
- What channel performed best?
Create your own goals
In the admin panel of Google Analytics, you can create custom goals. For example: a goal can be triggered when a user lands on a confirmation/success page.
If someone orders sales material for an apartment, that’s a goal or transaction.
Nybolig—or any other company—can now see where these users came from:
- Google?
- Facebook?
- A partner site?
Plus, they’ll be able to see the demographics. Remember the earlier section?
This allows Nybolig to identify which property types to market in Aarhus S versus Aarhus N – not based on feeling, but on real data.
That’s where things get powerful!
Personal trainer example
Let’s say you’re a personal trainer. You run Facebook ads to get more people to buy sessions at your gym. Using goal tracking, you discover that most conversions come from women aged 30–45 living near you.
You can now go back and optimize your ads—avoiding waste on less relevant age groups.
Again: every business can define a goal to track.
Recently, at a digital conference, some said Google Analytics delivers “dead” data you can’t act on. In my opinion, that’s because the person behind the screen doesn’t know how to read the data correctly.
No matter what kind of online shop or service you run (even apps), Google Analytics offers countless opportunities for optimization and audience understanding.
What is a customer worth? (advanced)
This section might be a bit heavy, but it’s one of the most important topics in e-commerce right now.
I’m still learning in this area myself, thanks to close collaboration with Jesper Hvejsel and Rasmus Dencker from Firtal, where I serve as CMO. They have far deeper expertise in data infrastructure than I do but it’s great there’s always more to learn!
Start learning online marketing
Customer acquisition cost (CAC)
CAC = What does it cost to acquire a new customer? This can vary by channel. You can use CAC to determine if a channel is viable, especially when compared to CLV. It’s also a great benchmark when entering a new market.
Customer lifetime value (CLV)
CLV = What is a customer worth over time? Since we don’t know how long a customer will stick around, we usually use a 12-month period as a basis. The longer you’ve had your business, the better your cohort analysis can become.
Let’s do a simple CAC/CLV analysis
- You acquire 100 customers via Facebook at 100 DKK per customer (CAC)
- These 100 customers generate 100,000 DKK in revenue
- That means each customer is worth 1,000 DKK (CLV)
- Net result: 90,000 DKK in revenue attributed to Facebook
But what if Google Ads gave you a much lower CLV?
- Is it due to poor landing pages from Adwords?
- Do you offer better deals on Facebook?
If CLV drops to 50 DKK while CAC remains 100 DKK… your profit is gone.
It’s a rough example, but this kind of analysis helps you:
- Decide which channels are worth investing in
- Avoid burning money in new markets
- Stay on top of your marketing budget
If these terms feel too complex, check out my digital glossary.
I know, it’s a bit technical. But I hope you see how insanely powerful data can be when used correctly.
#Tip: Once you’re comfortable with CLV analysis, segment your customer base. Segment groups via Sequel Pro, like VIP customers. The more segmented your data, the easier it is to learn:
- Where do your best customers come from?
- What is their demographic?
- What products do they prefer?
Churn
I think companies shouldn’t just focus on how many customers they gain – but also how many they lose.
Churn = Customer loss. What percentage of your customers do you lose each month?
It’s easier to retain current customers than constantly acquire new ones. If your churn is high, ask yourself: are you following up well enough?
For more on churn models, check this brilliant article on Kissmetrics.
Tips to retain more customers
- Follow-up emails with similar products
- Re-marketing campaigns via display
- Facebook re-marketing
- On-site personalization (check out ASOS and Zalando)
My ASOS example
I’ve always been a big fan of ASOS—they get so many things right as a customer-focused brand.
Just checked my account: I make 5–10 orders per year, average order value = 500 DKK. I’ve been a customer for 4 years.
That’s ~30 orders = 15,000 DKK CLV
With margins around 10–30%, that’s a significant profit.
In fashion, retention is crucial. CAC is very high.
Tons of competitors with deep pockets drive ad prices way up. If they sell the same brand—I’ll just choose the cheapest, right?
So how much do you think ASOS is willing to pay to keep me?
ROI (Return on investment)
One final metric worth understanding is ROI: Return on your investment.
If you spend 5,000 DKK on Adwords and generate 10,000 DKK in revenue, your ROI is 50%. Of course, you still need to subtract costs like products, salaries, etc., to get the real picture.
Make data-driven decisions
A/B split test everything
At Firtal, we spend a lot of time running A/B tests. Plenty of tools exist to help.
Currently, we’re testing if the “Trygg e-handel” logo on Made4men.se helps or hurts conversion.
We split traffic 50/50:
- Half see the logo
- Half don’t
We use Visual Website Optimizer, and once enough data is collected, we decide—based on the numbers—if we should keep it.
Smart, right? Think of how many things you should be testing right now.
Does the channel even work for you?
One of the worst parts of being in the online space is how misunderstood it still is (hopefully I’ll get to teach this someday!).
I’ve seen businesses throw money at Facebook Ads without knowing what they actually get in return—sales, branding, or assist value?
#Tip: When testing a new marketing channel, start with a very small budget. Use Google Ads or Facebook. After 2–3 days, you’ll already have some data to optimize campaigns or adjust pricing.
Conclusion
It’s important to understand how valuable it is to improve your data usage in marketing. I’m not saying you need big dashboards like mine—but small steps can take you far.
Start by giving yourself small tasks:
- Explore Google’s demo account
- Install Google Analytics on your site
- Try out the exercises from this guide
- Run your first CLV / CAC analysis
- Conduct your first VWO test
I can’t wait to hear how it goes!
Already tried some of this? Share your experiences in the comments—or let me know if I missed anything. Data is an amazing thing!
FAQ: Big Data & Web Analytics
What do I need to get started with big data in marketing?
You don’t need an advanced setup to get started with big data.
The most important things are proper tracking, defined conversions, and a basic analytics tool like GA4.
Big data only becomes relevant when you start combining multiple systems like CRM, ad platforms, and website data.
Start simple and focus on structure first – otherwise your data quickly turns into noise instead of insights.
Is GA4 considered big data or just web analytics?
GA4 is fundamentally a web analytics tool, not a big data system.
It collects behavioral data from your website but only works with a single data source.
You only move into big data once you export and combine it with other systems like CRM, ads, or product data.
So GA4 is a strong foundation, but not a full data infrastructure.
Why is event tracking more important than pageviews?
Pageviews only tell you that someone visited a page. They don’t explain intent or behavior.
Event tracking shows what users actually do, for example clicks, purchases, scrolls, and sign-ups.
This gives a much clearer picture of traffic quality and user engagement. Without event tracking, you’re essentially analyzing behavior in the dark.
What is the simplest setup for web analytics?
A simple setup usually consists of three core elements.
First, proper event and conversion tracking on your website. Second, an analytics tool like GA4 to collect and visualize the data. Third, a consistent UTM structure so you can clearly identify traffic sources.
How do I know if my tracking is set up incorrectly?
You usually detect tracking issues when your data doesn’t make sense across systems.
Common signs include missing conversions, duplicate events, or unexplained traffic spikes.
Another red flag is when campaigns can’t be reliably tracked using UTM parameters.
Good tracking should be stable, consistent, and easy to explain.
Why don’t my marketing numbers match across platforms?
It’s completely normal for numbers to differ between platforms.
Google, Meta, and analytics tools use different attribution models, time windows, and conversion rules.
This means the same sale can be credited multiple times across systems.
It’s usually not a tracking issue, but a measurement and attribution difference.
Instead of focusing on exact numbers, you should look at trends and overall patterns, for example which channels drive growth over time, how performance changes when budgets increase or decrease, and how channels interact across the customer journey.
Why is ‘direct traffic’ so high in my analytics?
High “direct traffic” rarely means people are actually typing your URL manually.
It is usually caused by lost tracking due to cookies, apps, redirects, or missing UTM parameters.
When a system can’t identify the source, traffic gets labeled as “direct”.
In most cases, it represents unknown or untracked sources rather than true direct visits.
When does it make sense to use a data warehouse?
A data warehouse only makes sense when you need to combine multiple data sources.
For example, GA4 data, CRM data, and ad platform data in one unified system.
If you’re only working with one or two tools, it’s usually unnecessary complexity.
It becomes relevant when you need a single source of truth for decision-making.
How do you use big data to make better marketing decisions?
Big data only creates value when it connects data across channels and systems.
This allows you to see the full customer journey instead of isolated touchpoints.
It helps you understand which actions actually drive revenue and long-term growth.
The goal is not more dashboards, but better decisions based on context.
What is the biggest mistake people make with big data?
The biggest mistake is assuming that more data automatically leads to better insights. Many end up with dashboards without direction and data without action.
Without clear business questions, big data creates complexity instead of clarity.
The key is to start with the decision you want to make – not the dataset itself.


Comments