


Where on earth did those sales come from? The ultimate guide to attribution (and everything that comes with it)
Sit back on your couch, on the couch and get comfortable like you’re about to start a meditation session.
But my goal isn’t to put you to sleep; it’s to give you insights into what I believe is one of the biggest challenges modern marketers face.
Where should I invest my money? Which channels are irrelevant? Is Facebook worth it? Should I really spend this much time and money on this particular channel? Why is there such a huge discrepancy between Facebook’s data and Google Analytics’? Is YouTube advertising worth the investment? Should I throw money at influencers?
There are a lot of questions in marketing right now – and all of them orbit the same central issue: attribution.
What does attribution really mean?
Instead of giving you a textbook definition of the word “attribution,” let’s take a quick step back in time.
A few years ago, marketing looked very different when the number of media outlets available to us on a daily basis was drastically limited compared to our lives today. We could read the newspaper, watch TV, listen to the radio, or be exposed to ads in the physical world.
Since then, everything has changed. We now live in a world where we have unlimited access, not only to the number of devices, but to the number of touchpoints. Think social media platforms (Instagram, Facebook, TikTok, Snapchat, Twitter, Pinterest) the list is long.
Not to mention emails, SMS, web push notifications, and traditional media.
Marketers have also gotten much smarter about understanding the psychology behind the ads they show consumers. All of this leads to my main point: our attention spans are more cluttered than ever before.
The attribution landscape has changed
This has completely changed how marketers work today.
The big question is simple: Where do our sales actually come from, what can we shut down, and what should we ramp up?
The animation below offers a humorous but insightful take on how hard it is to navigate this.
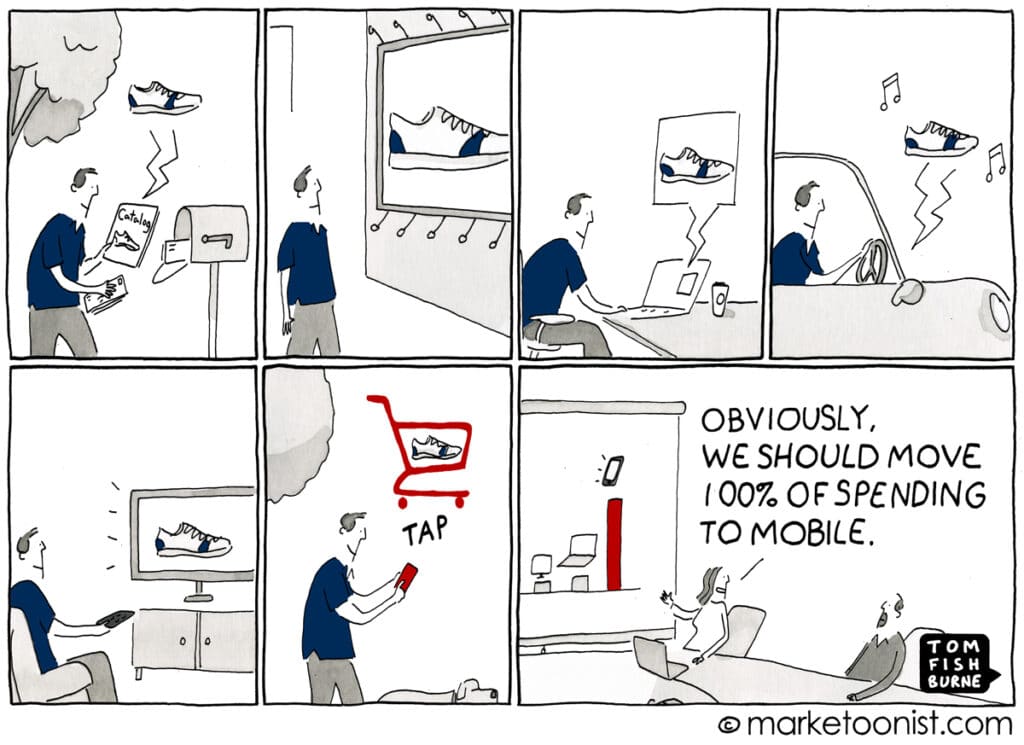
Animation explained
Looking at the animation, you might think the sale starts when the customer receives a flyer in the mail.
But when we look into our analytics systems, we don’t see “post” as a data point. Instead, this sale might be credited to “direct traffic” if the person typed the URL directly into their browser, or “Google Ads” if they searched for the product or brand before purchasing.
So, attribution is a term we use to describe how we assess the interplay between channels; how each one influences the other and how we assign credit to one channel over another.
This is all about figuring out where to place your marketing efforts.
The old mindset of attribution
After analyzing this, a marketing manager might naturally report to their CEO that mobile should be the focus and that print advertising doesn’t work.
The same goes for billboards or Facebook retargeting touchpoints that the customer may actually have been exposed to but that aren’t credited.
In companies with divided marketing departments, this can create serious conflict between those who handle traditional marketing and those who work with digital tools. So who’s right?
As this example shows, there’s no simple solution.
But one sure way to end up with a distorted budget is to invest based solely on what appears in Google Analytics, often due to the traditional “last click model,” which we’ll dive into shortly.
Cases & examples
I’ve seen wild examples of businesses increasing spend on Google Ads, even though the sales coming from that platform were actually driven by an increase in brand searches – something Google Ads doesn’t directly influence unless you’re running Display or YouTube campaigns.
Brand searches, however, often spike due to efforts on social media, influencer marketing, TV ads, radio, etc.
So here’s your first tip: Monitor your brand searches on Google they reflect how top-of-mind your brand is with consumers.
Same goes for TV
Even if you get a report from your media agency or TV team, you still won’t directly see in your data if a customer saw your TV ad and then made a purchase. Unless they can click on the TV or you’ve implanted a chip in their brain – neither of which is currently realistic – you won’t get that level of visibility.
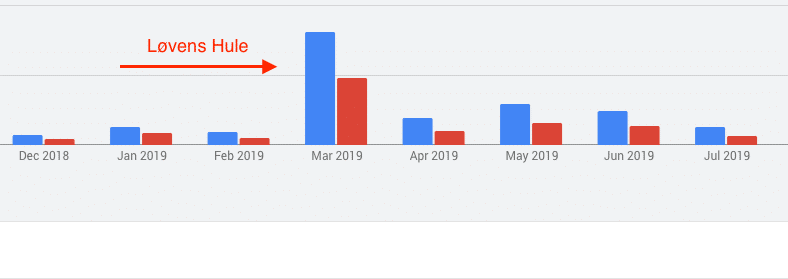
What you will see, however, is a surge in brand searches – data you can pull from Google’s Keyword Planner.
For example, when the Danish version of Shark Tank (Løvens Hule) airs, there’s a clear spike in searches for the businesses featured in the show. One example is “Myselfie,” which appeared in 2019.
You can clearly see when their episode aired.
Attribution models
There are many attribution models. The ones most often mentioned and actively used are found in platforms like Facebook and Google Analytics.
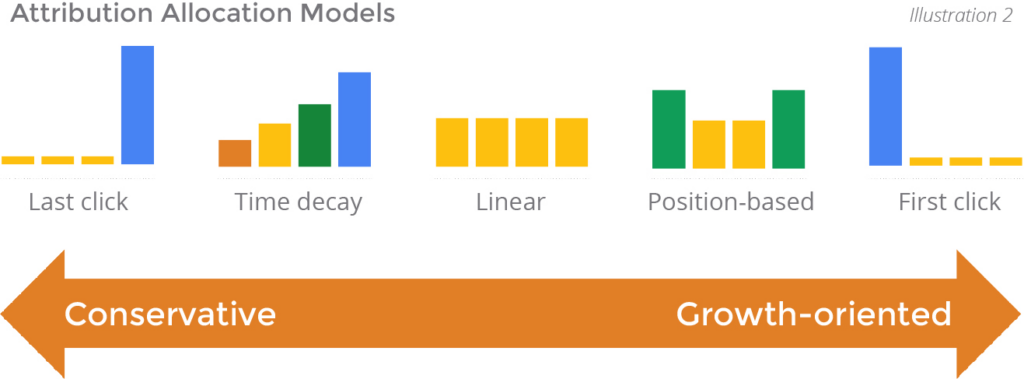
Source: Medium – In depth digital marketing attribution
Let’s go through them quickly.
Last interaction
The default model in Google Analytics. It gives 100% credit for the sale to the last touchpoint before the conversion.
The downside? It ignores the entire customer journey and leads to conclusions based only on the final step – not necessarily the decisive one.
There are slight variations like “Last non-direct click” and “Last Google Ads Click,” but generally “last interaction” refers to this final touch approach.
First interaction
This model gives all the credit to the first touchpoint before the sale.
Again, it ignores everything that follows even if that follow-up was crucial to convincing the user to buy. Maybe they saw a Facebook ad, signed up for a newsletter, and then got influenced by a creator. None of that counts here.
Linear
The linear attribution model distributes credit evenly across all touchpoints.
While fairer in theory, it has the flaw of treating every channel equally even though some might’ve had more influence than others.
It works okay in businesses with few channels and short, consistent customer journeys. But it’s rarely optimal.
Time decay
This model gives increasing credit to touchpoints closer to the conversion.
So if there are five touchpoints, the first might get 10% credit while the last gets 50%.
The idea is that later interactions are more influential. But is that true? Maybe not. Without the first touchpoint, the journey wouldn’t have even started.
Position based
This model assigns the most credit to the first and last touchpoints, typically 40% each, then splits the remaining 20% across the middle interactions.
This is actually one of the better models, but again it assumes the first and last are the most important, which isn’t always true. Still, it’s a practical compromise.
Custom models / data driven models
As the number of devices and platforms has exploded, so too has the number of attribution models.
Some companies are building their own platforms an incredibly complex and time-consuming task.
Meanwhile, machine learning–based or data-driven attribution models are on the rise.
These models analyze vast amounts of data about your users and build customized models showing how they become customers. I believe this space will continue to grow and evolve.
Differences between systems
There’s a big difference in how major platforms (especially Google and Facebook) report data. Many believe these platforms over-credit themselves to justify ad spend.
But I don’t think it’s that simple. I think even these platforms struggle to explain how they influence user behavior because it’s more psychology than data.
The biggest challenge? They’re run by different companies. So building a unified attribution system is nearly impossible.
Plus, we as consumers behave differently across platforms, even when buying the same product.
Facebook & Google
Google is typically where people search for products or brands they already know about. You don’t go to Google asking, “What should I buy today?” you already have an idea.
In contrast, Facebook and Instagram are more for inspiration, entertainment, and connecting. Comparing the two as if they’re the same type of marketing channel makes no sense they’re complementary, not competitive.
There are also technical reasons these platforms show different results.
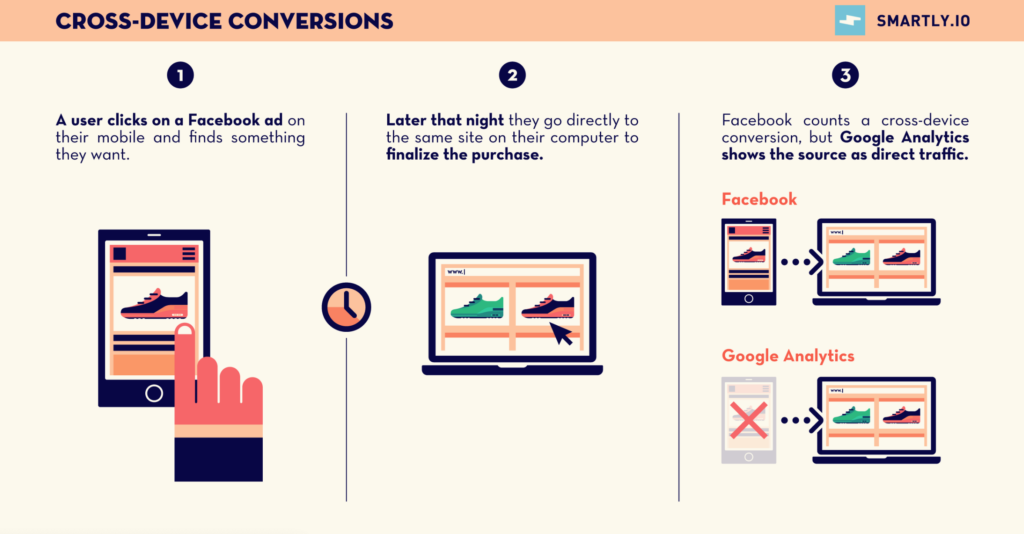
Cross-device tracking
Facebook has the advantage of tracking users across devices, while Google mostly relies on cookies.
People often switch between desktop and mobile during the buying process. Facebook recognizes this as a single user. Google, on the other hand, may log it as two sessions, because it’s two devices.
This difference becomes very apparent in behavior animations produced by analytics tools.
A psychological exercise
Next time you make an online purchase, try to remember how you were influenced. You’ll go through 200+ subconscious decisions per minute leading to the purchase. Meanwhile, people like me are trying to reverse-engineer that process.
Chances are, you won’t even remember why you landed on ASOS and bought that scarf. Maybe it was a text, a newsletter, a friend’s suggestion, a Facebook ad, or an influencer.
My point is: If you can’t even recall how you got there, imagine how hard it is for marketers to determine what actually worked. Even with more data than ever, connecting cause and effect in customer behavior is harder than it’s ever been.
Google Analytics
Google Analytics has for many years been the preferred tool for almost any kind of online presence. And thanks to Google for building such a powerful tool.
However, it does have its limitations – especially if you’re not data-critical.
Google Analytics contains several pitfalls, which I won’t go into here. Instead, I recommend you watch the webinar I created earlier.
When it comes to attribution, the biggest mistake is that most people simply log into their Google Analytics account, see that Google Ads and Google Organic contribute to sales, and then base their marketing decisions solely on that.
They don’t consider underlying factors, like how many people are searching for their brand or how customers came to search for the brand or product in the first place. In other words: they forget the customer journey.
… Still with me?
Great! Here’s the challenge with Google Analytics.
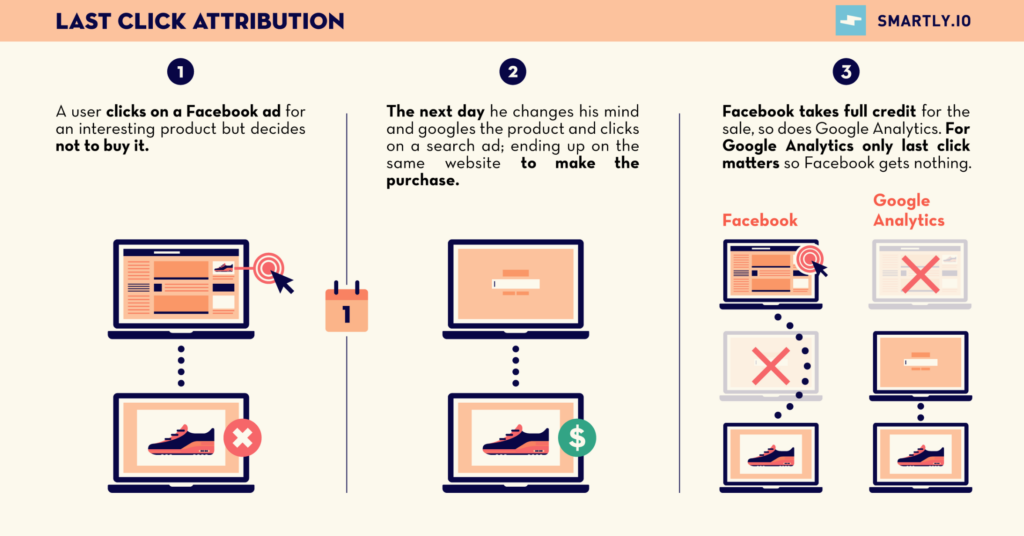
Google Analytics – Last click
Part of the challenge lies with one of the models we discussed earlier.
Remember our review of attribution models? Google Analytics defaults to the “last click” attribution model – this means it only credits the final channel that led to a sale.
So, it ignores the channels that helped influence that purchase along the way.
In other words, you get an oversimplified view of which channels affect each other.
Google Analytics – Attribution beta
This isn’t because the folks at Google are clueless – far from it.
They’re constantly working to improve their tools to meet the growing demands from us marketers, helping ensure Google Analytics remains the most used analytics tool in the world.
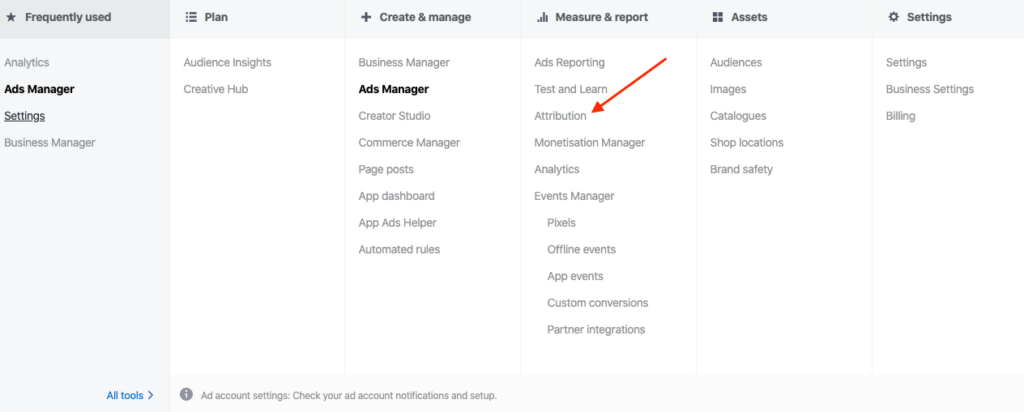
That’s why they’ve added a new feature, currently in beta, aptly called “Attribution.”
Here’s how you can access it from your Google Analytics dashboard.
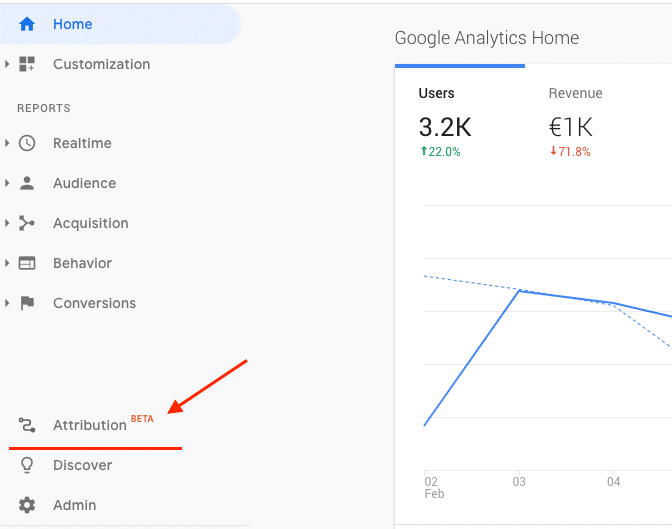
This tool allows you to dive into one of the attribution models I previously mentioned positively – the “data-driven attribution model.”
Note: Before rushing into your Google Analytics dashboard to find this lovely feature, be aware that it’s not available to everyone just yet.Google has stated that you need at least 600 conversions, and the algorithm needs at least 30 days to crawl the data.
If you have access, I recommend setting it up and letting Google start crawling. I’ll share a few case studies once I’ve had more time to analyze across the 10 accounts I’m currently working with.
Facebook pixel & data analysis
Facebook has long faced criticism for seemingly taking credit for a large portion of sales generated on webshops, even when it can’t be directly tracked.
Let’s clarify how Facebook tracks activity.
You insert a small code on your site called the “Facebook pixel.” This pixel matches data and behavior on your website with data from Facebook.
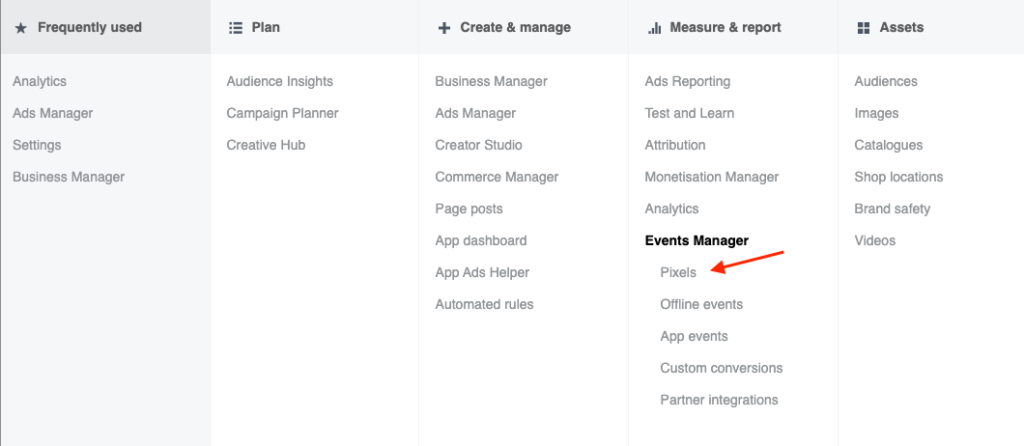
When you use Facebook Business Manager and Facebook’s ad platform (which also handles Instagram), you can install this pixel.
Once active, it matches user behavior on your website with their Facebook or Instagram profiles. That way, you can see whether your ads are driving conversions.
If you run a webshop, you might recognize the kind of data shown below in your Facebook reporting.
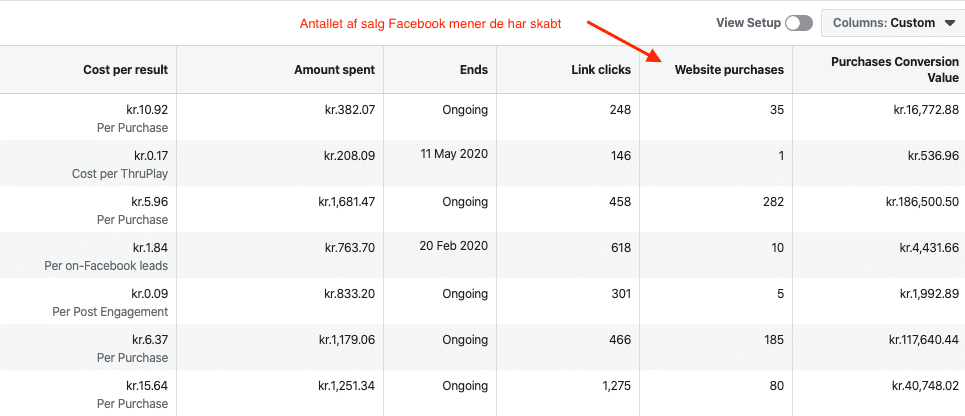
These are the numbers people often find suspiciously high. Besides potential pixel misconfiguration, once again attribution plays a role.
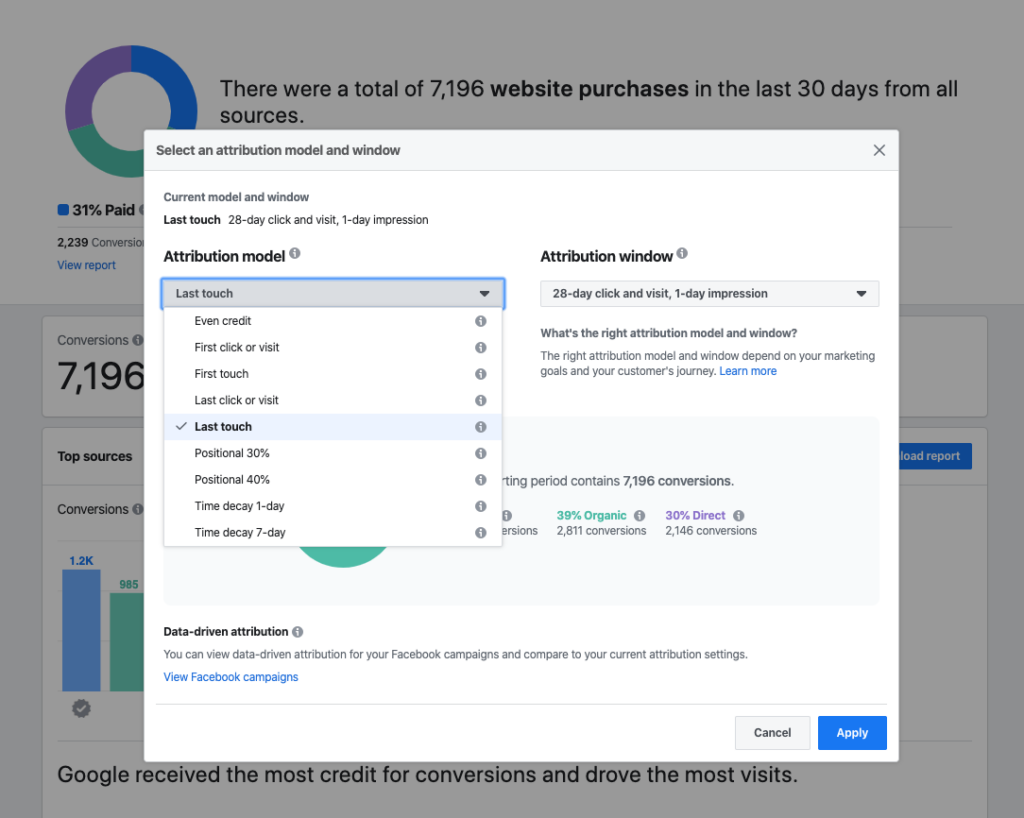
Facebook’s standard attribution window is: 1-day view & 28-day click
This means that if a user sees an ad and purchases within 24 hours (without clicking), Facebook gets credit. In Google Analytics, the sale might be attributed to another channel – especially if users switch devices.
It also means that if someone clicks on a Facebook/Instagram ad today but purchases within the next 28 days, Facebook still gets the credit.
The challenge is this:
How much credit should a “viewed ad” get versus an actual action taken on the website? Should Facebook get credit for 28 days after a visit?
Facebook Attribution system
Facebook has also tried to address this issue with a tool available in Business Manager called “Facebook Attribution.”
Like Google Analytics, Facebook attempts to give us deeper insight into user behavior.
The challenge remains, we don’t have chips in people’s heads (despite Elon Musk’s efforts), so we still need to interpret the data critically.
As shown below, you can view different attribution models within Facebook as well.
Here’s a screenshot of how to choose a different attribution model in Facebook.
Which numbers should you trust?
That’s a tough question, it depends on your industry and product. Here are two simplified examples:
Clothing webshop
If you sell clothing online, customers tend to make repeat purchases. In this case, Facebook impressions likely receive “too much” credit. A shorter attribution window might make more sense, possibly excluding views.Car dealership
In contrast, buying a car takes longer. Google once published a case where a woman had 900 touchpoints before making a purchase. Here, longer attribution windows might be justified.
But Micky, can’t we just turn off a channel for a month?
I’ve heard this question countless times, but it’s not that simple.
Facebook ads and branding efforts often have a long-term effect. Turning them off for a month may not show immediate results.
The bigger issue is seasonality. You can’t test one month against another – they’re always different. Weather, holidays, global events, stock levels – all play a role.
More channels = more data = more complexity.
Future systems
Many marketers are exploring new systems. Facebook’s Atlas, Google’s new Attribution feature, Adform, and Google’s DoubleClick platform are all worth looking into.
If you’re ready to tackle the attribution challenge, these tools might be a good place to start.
Think of your marketing as a funnel
You can’t just run brand-name Google Ads. You need to reach potential customers at every stage especially if you’re new to the market.
Let’s revisit the classic marketing funnel.
- Top funnel – New potential customers being introduced to your brand, service, or product. These are “cold leads” you want to guide toward a purchase. Here, you test which messages create engagement. Use everything from social media (Twitter, LinkedIn, Facebook, Instagram) to TV, radio, and print. Exposure is key – tailored to your industry.
- Mid funnel – These people have some knowledge of your brand. They’re not yet convinced but easier to convert. Influencers, newsletters, and brand personality play a big role here. Why should they choose you?
- Lower funnel – These customers know your brand. They might’ve abandoned their cart or just need a small nudge. They may find you through brand search, Facebook retargeting ads, or cart abandonment emails.
- Retention engine – This is your loyalty machine. Retaining customers through good service, email flows, and personal touches is cheaper than acquiring new ones. Companies that master this enjoy a higher LTV (lifetime value). Amazon’s Prime model is a prime example.
My model for data analysis – for start-ups
Certain data points are becoming more critical for businesses.
Instead of making this post longer, here’s a simplified model you can copy and apply to your own marketing:
- Cost per acquisition – How much do you pay per customer?
- LTV – Lifetime Value of your customers
- Brand searches – How many monthly searches does your brand get?
- Retention rate – How well do you retain customers?
Glossary:
- Ads = advertising
- Marketing spend = total amount spent on marketing
- Marketing % = marketing spend as a % of revenue
- Total customers = customers who ordered in the past 12 months
- CPA = cost per acquisition
- LTV = lifetime value
- Retention rate = month-over-month customer retention
What about B2B companies and attribution?
If you’re in a B2B company, everything above still applies.
However, a few things make attribution more complex:
Time
B2B deals take longer – 3, 6, even 12 months from first touch to sale. This makes it hard to tie marketing directly to closed deals.
People
Multiple decision-makers are often involved. For example:
- The user researches your product (your ads often reach them).
- Another person evaluates your solution.
- Finally, the CEO signs off.
In this case, you can only track the beginning of the customer journey, making it hard to link marketing costs to revenue.
Tools
Most tracking tools (Google Analytics, Ads) are built for single-device, single-user journeys. Facebook and LinkedIn do better with cross-device tracking, but none fully capture a B2B timeline.
That’s why your team should define what signals are meaningful for you – newsletter signups, ebook downloads, demo bookings, etc.
Conclusion & future challenge – ITP (Intelligent Tracking Prevention)
As if ending a meditation session, we wrap this post by exhaling and tuning into our surroundings.
I hope this gave you insight into what I see as one of the biggest challenges in modern marketing.
But you don’t leave this post without a final thought.
While I try to avoid doom predictions, there’s one digital trend that may further muddy our data waters:
ITP – Intelligent Tracking Prevention
We saw this with ad blockers, which disrupted banner advertising. Now, Apple is making Safari delete cookies after just 24 hours.
That means we lose user tracking after a day – each visit may look like a new session.
There are many ongoing solutions being tested. If you find the topic interesting, I highly recommend digging deeper into it.
As always, I welcome your feedback and questions.
Have a fantastic day!
FAQ: Marketing attribution
Do small businesses even need marketing attribution?
Yes, but the level of complexity depends on your marketing setup.
If you’re only using one channel, the need for attribution is limited. But as soon as you start working across multiple channels like Google Ads, Meta Ads, and email marketing, attribution quickly becomes important.
Even a basic understanding of what drives your conversions can make a big difference in how you allocate your budget.
You don’t need advanced models to get value. For many small businesses, simply knowing which channels contribute to sales is enough to make better decisions.
What’s the difference between tracking and attribution?
Tracking is about collecting data, while attribution is about interpreting it.
You can have perfectly set up tracking and still make poor decisions if your attribution model is too simplistic.
That’s why both parts matter. First, you need reliable data. Then, you need the right framework to understand what that data actually means.
Attribution is what turns raw data into actionable insights.
How do I know if my attribution model is accurate?
Many businesses take their data at face value without questioning it. One common red flag is when a single channel, often “direct” or branded search, gets a disproportionate amount of credit for conversions.
This can indicate that earlier touchpoints in the customer journey aren’t being tracked properly.
A good approach is to compare multiple attribution models. If your results vary significantly, it’s a sign that your current model isn’t telling the full story.
What’s the biggest mistake with marketing attribution?
One of the most common mistakes is relying too heavily on last-click attribution.
While it’s simple to understand, it often ignores the channels that created awareness and interest earlier in the journey.
This can lead to underinvesting in important top-of-funnel activities.
Attribution isn’t just about measuring conversions – it’s about understanding the full path that leads to them.
Which attribution model should beginners use?
If you’re new to attribution, it rarely makes sense to jump straight into advanced models.
A good starting point is to compare last-click with a more balanced model like position-based or data-driven attribution.
This gives you a more nuanced view without adding too much complexity.
The goal isn’t to find the perfect model, but to understand how different models change your perspective on performance.
How do long customer journeys affect attribution?
In industries with longer decision-making processes, like B2B or high-ticket products, attribution becomes more complex.
Customers often interact with multiple channels over time before converting. This means simple models rarely reflect reality.
Instead, you should focus on multiple touchpoints and assisted conversions to understand what actually drives results.
Can I trust data from platforms like Meta and Google?
Ad platforms tend to overestimate their own performance.
This is partly due to different attribution windows and measurement methods, which means both Google Ads and Meta Ads may claim credit for the same conversion.
To get a more realistic view, you should compare data across platforms and use a more neutral, top-level analytics tool like Google Analytics.
No single platform gives you the full picture on its own.
How do cookies and privacy changes affect attribution?
Privacy changes over the past few years have made attribution more challenging.
Limitations on cookies and tracking mean you can no longer follow users as precisely as before.
This creates gaps in your data and makes exact measurement harder.
As a result, many companies are moving toward modeled data and working with probabilities rather than perfect accuracy.
What tools should I use for marketing attribution?
There are many tools available, but the most important thing is choosing one that fits your setup.
Many businesses start with Google Analytics, which provides a solid overview of traffic and conversions.
Others use tools like HubSpot or Triple Whale for more advanced setups.
That said, tools are only as effective as how they’re used. Start simple and expand your setup as your needs grow.
How do you set up marketing attribution in practice?
Attribution starts with proper tracking.
This means setting up pixels, events, and conversions correctly on your website.
It’s also important to use UTM parameters so you can clearly see where your traffic comes from. A typical setup might include Google Analytics, properly configured events, and consistent campaign tagging.
It doesn’t need to be complex from the start, but it does need to be structured. Small setup errors can quickly lead to misleading insights.
How does attribution affect my budget?
Attribution plays a key role in how you allocate your budget.
If you only look at last-click data, you risk overinvesting in channels that “close” the sale and underinvesting in those that create demand.
A better understanding of attribution allows you to distribute your budget more strategically.
This often leads to stronger overall performance across your marketing efforts.
When does advanced attribution make sense?
Advanced attribution becomes relevant when you have enough data and multiple active channels.
If you’re only using one or two channels, simpler models are usually sufficient.
As your setup becomes more complex, the need for better insights increases. The key is to match your attribution approach with your level of maturity and ambition.
How do you work with attribution on an ongoing basis?
Attribution shouldn’t be a one-time exercise – it should be part of your ongoing marketing process.
This means regularly analyzing your data, testing different models, and adjusting your strategy based on insights.
A practical approach is to review your channels monthly and evaluate both first-touch and last-touch contributions.
This gives you a more complete picture and helps you make better decisions over time.


Comments